In the Floyd case, the NYPD faces tough scrutiny of Stop-and-Frisk tactics

Patch of New York City Police Department

This article was originally written for The Guardian, here.

The New York Police Department is on trial in Floyd v City of New York, and the public is watching.

It is ironic that the policy of recording “stops, questions, and frisks” originated with the 1999 police shooting of Amadou Diallo (and subsequent acquittals), and the 1997 torture of Abner Louima in a Brooklyn police station. The US Civil Rights Commission intervened, and data have since been collected on the UF-250 forms. Over a decade later, vigils and protests in response to the police shootings of RaMarley Graham, 18, last year, and, just last week, Kimani Gray, 16, pose tough questions about whether progress is being made in police-community relations.

Three 2012 cases, regarding the Open Container lawmarijuana arrests, and suspicion based on a “hunch”, indicate that the NYPD‘s approach to the fourth amendment is coming under close scrutiny. Justice Shira Scheindin has also hinted in Floyd pre-trial proceedings that “high crime area” and “furtive movements” could be coming under fire: these key phrases have become vague standards for police to justify “probable cause” to search.

The scale of the “stop-and-frisk” problem

Class action civil rights cases allow us to look at data on a systemic level. A class action suit is the affordable option for NYC taxpayers and the court. If each plaintiff were to bring a harassment lawsuit against the NYPD under civil rights provisions of Section 1983, it would crash the system.

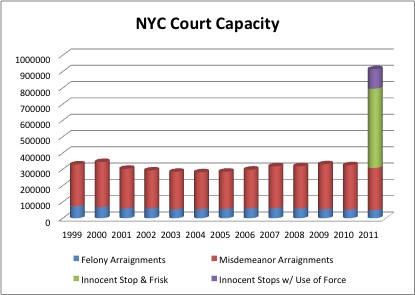
Over the past decade, NYC has arraigned roughly 300,000 stop-and-frisk cases per year (pdf). If individual cases were to begin flooding the court calendar, the calendar would triple in size overnight. In 2011, the NYPD self-reported 119,163 “uses of force” where there was neither arrest nor summons issued; furthermore, they frisked 324,700 people and issued no form of citation.

Some young females have complained that their frisks amount to groping. Whether minor or severe, the “frisking” cases exceed the number of misdemeanors in the courts.

Speaking Monday, as Floyd got underway, New York Mayor Michael Bloomberg defended the NYPD and the stop-and-frisk policy:

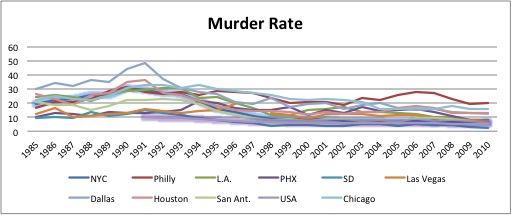
“This past week, with a city of 8.4 million people, we had one murder. I can’t imagine any rational person saying that the techniques are not working and that we should stop them. We believe we do it consistent with the law in terms of having reasonable cause … We don’t look at anybody’s ethnicity. We go where the crimes are.”

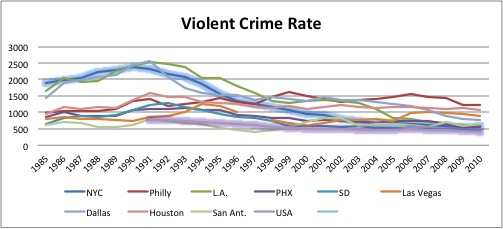
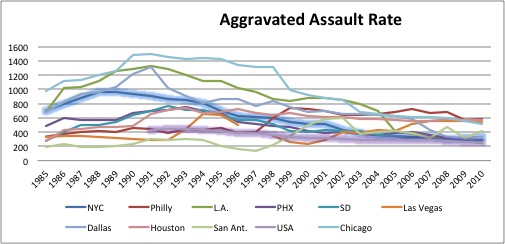
But murder rates – though a commonly used indicator of overall crime – are also a salacious, inaccurate, and often misleading metric. Homicides represent less than 1% of crimes. With such a small sample, a murder rate can fluctuate with every single incident.

Murders are misleadingly used as a leading indicator of public safety. But any study on “safety” would always have an element of subjectivity. What is “safe”? It is a feeling, not a fact. It is relative, and highly impacted by the media’s reporting of crimes, both near and far. In New York City, the numbers and the rhetoric don’t always match up.

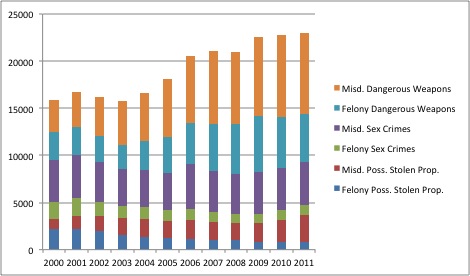
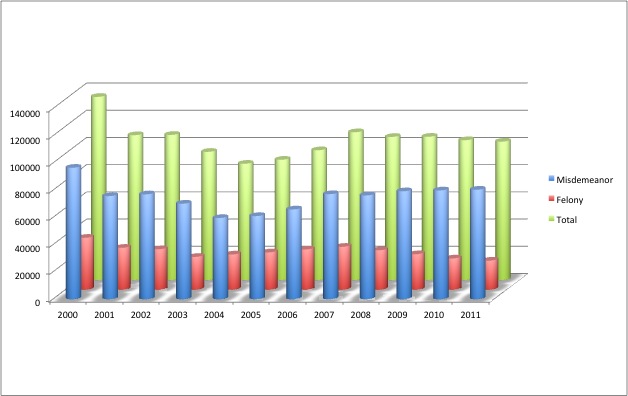
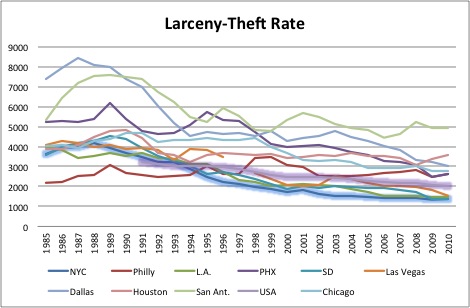
Data are manipulated: criminologist and former NYPD Captain John Eterno has explained how this manipulation is systemic. The New York Times made a study of 2,000 former police officials and found the same. Perhaps a sign of the manipulation is that some felonies (drugs, sex crimes, stolen property) have gone down, while their misdemeanor counterparts have risen.

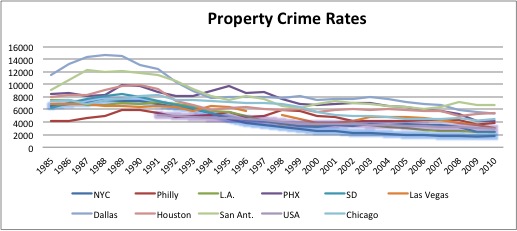
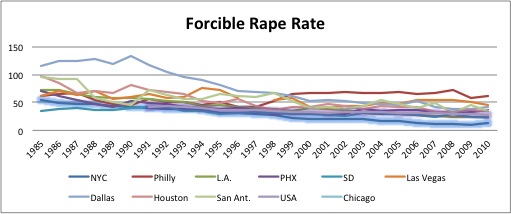
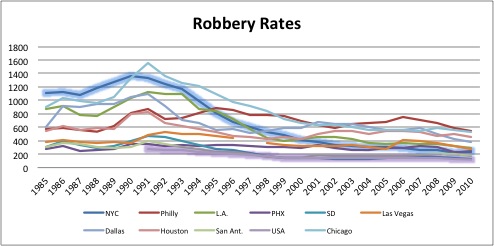
When looking at all the NYPD data, in the round, there are many indicators showing crime has risen in NYC.

Safer with stop-and-risk? How precincts match up

And what about the mayor’s claim that “we don’t look at anybody’s ethnicity”? When comparing the ten New York police precincts with the lowest percentage of black and Latino residents with the ten precincts with the highest percentage of black and Latino residents, the numbers are startling. Residents in largely white neighborhoods are being stopped on average at a rate of 4%, and crime in those precincts is falling by 42%. In communities of color, the frequency of stops is at 16%; while crime is dropping 22%. In other words, four times the hassle, for half the results.

But the true picture is worse than that. Thousands of residents in the financial district and Tribeca, for example, hardly represent the millions of people subjected to possible stops in that district. If police actually stopped 5% of all the people who travel through the tip of Manhattan, it would outnumber the residents of that precinct. Meanwhile, residents in districts like Hunts Point in the Bronx bear the entire brunt of the police activity, since tourists and workers aren’t flooding the precinct.

The fiscal cost of stop-and-frisk

A number of sources have shared their recordings of stops, including copwatch organizations such as All Things Harlem. It is clear that there is a wide chasm between the real stops and the NYPD’s textbook example. Even on the most conservative estimates, we can see the level of resources expended to continue this policy, which is directed primarily at black and Latino young men and boys.

The annual 685,724 stops require over 80,000 hours to complete. This works out at over 229 hours per day spent stopping, questioning, and frisking the city’s residents. Officers earn over $22 per hour after six months, and so taxpayers dole out well over $11 per stop, the vast majority of which will not yield a summons or arrest and are rarely connected to looking for a particular suspect.

This $7.5m conservative estimate is nothing, though, when compared to the $135m the NYPD has cost the taxpayers (pdf) in litigation costs relating to stop-and-frisk lawsuits. This amount will likely continue to spiral upwards, considering just the recent highly publicized cases. In the case of Kimani Gray, it has been reported that the two police officers involved in the shooting of the Brooklyn teenager have racked up $215,000 in litigation settlements over civil rights violations. The spike in civil rights and police action claims in recent years suggests a deteriorating relationship with their communities.

Creating safe communities or fostering suspicion and division?

Even if we set racial targeting and constitutional protections aside, the ultimate social questions are whether it is acceptable for nine innocent people to be harassed for every one person caught engaging in some form of misconduct; further, whether it is acceptable for 20 innocent people to be harassed for every one person caught doing something reasonably serious; and finally, is it acceptable for 90 innocent people to be harassed for every one person caught doing something actually dangerous?

The answer to these questions may be “yes” for some people. But it is an answer that should apply to one’s own community, and not be imposed on others’. For example, would supporters of stop-and-frisk feel the same way if college dorms were targeted … especially if the “hit rate” for criminality were higher? The current state of affairs appears to many as a massive campaign designed to erode stability in communities of color: distrust, despair, and hate then compound the dilemma of labeling young men with criminal records. Families lose income, children lose parents, and low-income New Yorkers lose the right to live in public housing. One person’s plight provides little insight; we need to look at the policy’s collective impact upon millions.

The Floyd case has allowed some long-excluded voices to finally be heard, but are the police listening? Considering one of the shooters of Amadou Diallo has been working with a badge but no gun ever since, earning over $1m from the NYPD, it is challenging for urban residents to feel protected and served. To know you are a “suspect” for simply walking down the street, the feeling is closer to being under occupation.

Posted in Courts, Police, Race | Tagged , , , , , , , | 1 Comment

What They Don’t Tell You About NYC Crime Data

NYPD Traffic Enforcement Units on Times Square...

Any study on “safety” would always be subjective.  What is “safe?”  It is a feeling, not a fact.  It is relative, and highly impacted by the media’s reporting of crimes- both near and far.  Looking at the NYPD’s crime reporting, it appears that the numbers and the rhetoric don’t always match up.

When the Village Voice ran an investigative piece with the help of NYPD officer Adrian Schoolcraft, it launched a general disbelief in the data being generated.  The incentive to downgrade serious crimes, while Stop & Frisk increases petty crimes, serves as a justification for “Broken Windows” tactics.  Criminologist John Eterno (former NYPD Captain) explains that the manipulation is systemic and not confined to Schoolcraft’s 81st Precinct.  The New York Times recently ran a study of 2,000 former police officials and found the same.

The manipulation of data is not confined to the NYPD.  Police in Memphis, Nashville, and Millwaukee, and Ft. Myers have all either been accused of or admitted to this illusion of success.  Some police have conducted their own audits and explained that there was no clear intent to mislead the public.  The broader issue is whether criminologists can trust the data they are given for analysis, and whether crime rates are reliable as a method of gauging public safety. High crime data contributed to NYPD receiving federal funding through the COPS program, and then a reduction of that funding when the data was reduced.

Claimed Benefits (Crime Reduction) Is Not Supported by Data

It appears that police policy has no correlation to violent crime stats; only to petty crime stats.  For example, as Stop & Frisk intensifies, crime rates do not fluctuate accordingly.  Violent crime is immune to increased patrolling, while petty crimes such as marijuana possession, obstruction of justice, and open container summons will increase due to police contact.  If policing were reflective of criminal activity, we could assume that White residents on the Upper West Side do not smoke marijuana, unlike Black and Latino residents of East New York.  Or, only Black and Latino people in the West Village drink in open containers.

Murder rates are a salacious, inaccurate, and commonly used indicator of overall crime.  They are generally reported prior to a conviction, often prior to a full investigation, and sometimes prior to an arrest.  Homicides represent less than 1% of crimes.   If the media reports there were 1000 murders last year, what they truly mean is 1000 people were killed in ways where it was not immediately justified and cleared.  There may be only 600 arrests, and they may be sitting on Rikers Island.  100 of them may have viable defenses.  100 may have plead guilty already, while 50 others may be wrongfully convicted.  With such a small sample, a murder rate can fluctuate with every single incident.

Comparing Crime Rates of 10 Largest Cities

Looking at NYC as a whole, in isolation, does little to inform the public as to the effectiveness of the police force.  Crime has come down from the peak of the eighties and nineties, and back to levels of the 1970’s.  However, this is a long-recognized national trend.  By comparing NYC to the nine other largest American cities, we see that there is nothing particularly special about the Big Apple.  This assumes, of course, that data reported to the Bureau of Justice Statistics is compiled in the same manner by each police department.

  • NYC has a similar violent crime rate to Phoenix, Los Angeles, and San Antonio.[4]
  • NYC has had the lowest property crime rate since 1995, and had negligible reductions during the examined Stop & Frisk era.[5]
  • From 2002-2010, there has been virtually no change in the NYC murder rate, while Chicago, Phoenix, Los Angeles, and Las Vegas continue their reductions.  In 2010, San Diego the lowest rate, with NYC equal to San Antonio, Las Vegas, Los Angeles, and Phoenix.[6]
  • Forcible rape statistics continue to be perhaps the most under-reported crime, and NYC has consistently had the lowest reported rate.  From 1998 – 2009, NYC reduced at a rate greater than the national average, yet now is facing an increase.[7]
  • Although NYC had the highest robbery rate between 1985- 1990, it joined the middle of the pack in 2000, and in 2010 is similar to Phoenix, Los Angeles, Las Vegas, and San Antonio.[8]
  • The aggravated assault rate has risen since 2008, and NYC sits similar to, Dallas. Phoenix and San Diego are slightly lower, with Los Angeles at the bottom (tied with the national average).[9]
  • There has been virtually no change in the larceny-theft rate since 2002, and is now tied with Las Vegas, Los Angeles, and San Diego.[10]

NYC Crime has Gone UP!

Illustrating the allegations that NYPD has downgraded criminal reports to show a decrease in crime, observe these inter-related crimes:

  1. Misd and FelonyFelony Possession of Stolen Property has gone down while Misdemeanor Possession of Stolen Property has gone up;
  2. Felony Sex Crimes has gone down while Misdemeanor Sex Crimes has gone up.

2005 to 2011, by the Numbers- Drug Crimes Increase

Since the dawn of the Commissioner Kelly Stop and Frisk era, total crimes are down 2%.[11]  Meanwhile, total drug crimes have increased:

Drug Crime NYC


As Misdemeanor drug crimes increase, felony drug crimes decrease.  Does this reflect a reporting change?  Enforcement change?  Usage change?  A further example of trying to match data with reality can be found in Mayor Bloomberg and the NYPD’s challenging relationship with marijuana, and improperly arresting people who should be given citations only.

Do you believe, that catching people’s personal supply is impacting your safety?  Some do, and they are willing to pay billions of dollars to reinforce that policy.  Others are not at all convinced.

On a final statistical note:

Grand Larceny of an Auto has been reduced 380% since 2001.  It just so happens that manufacturing changes have drastically altered the ability to steal a car.  The police should not be blamed for everything, particularly where crime is related to many factors such as economics, social services, family stability, mental health treatment, and substance abuse (among other factors).  And to the same end, they should not be taking too much credit.

Read Part One of the series relating to Floyd v. New York City: “Crashing the System with Stop and Frisk.” 

Up Next: “Comparing the Precincts:  Is the data plain as Black and White?”

See alsoRevolt of the Gatekeepers

FICPM Statement on Stop and Frisk


[4] Figure 1.  NYC peaked in 1990, and follows a similar trajectory with L.A. and Dallas.  They had nearly the same rate: three highest in America’s large cities.  Dramatic reductions from 1993- 2000.  Reductions from 2002-2010 are minimal; far less than Dallas and L.A., and comparable to reductions in Houston and the national average.  Philly, Houston, and Las Vegas are the new top three, but modestly higher.Violent Crime Rate

[5] Figure 2.  NYC peaked in 1988, in the bottom third of the pack (tied with Dallas).  Chicago and San Antonio were the outlying highest.  Greatest reduction came from 1993-2000.  In 1994, NYC was tied with Philly as the lowest rate, and has become the lowest of all ten major cities; lower than the national average.  Reductions between 2002-10 are negligible, less than the national average, Dallas, Phoenix, Las Vegas, and Los Angeles.  In 2010, Los Angeles and San Diego are also below the national average.Property Crime Rate

[6] Figure 3.  NYC peaked in 1990, tied with Chicago and Philly, less than Houston and Dallas.  Dramatic reduction came in 1993-1998, and has practically mirrored the national average since.    Philadelphia began the era in the middle of the pack, but is now the highest by virtue of having made no real gains; they are still far below the 1990-92 norm.Murder Rate

[7] Figure 4.  NYC is highest in 1985, yet with the lowest figure than all cities but San Diego.  Dallas, Houston, and San Antonio realized the greatest reductions, yet began at the top of the list.  Los Angeles and Phoenix reduced at a rate similar to NYC.    Philadelphia has had little impact in this area, and now is the nation’s highest by virtue of standing still.  The Rape and Murder rates have reduced at a similar pace, with rape traditionally being close to double that of murder; however, the percentage points have narrowed from 34 to 6 over the time span.Forcible Rape Rate

[8] Figure 5.  NYC peaked in 1990, and followed a similar trajectory downward as did Chicago and Los Angeles.  The sharpest decline came in 1991 – 2000.  San Diego and the national average are lower.Robbery Rate

[9] Figure 6.  NYC peaked in 1988, when it was tied with Dallas behind Los Angeles and Chicago (the latter three cities all peaked in 1991).  The sharpest reduction came between 1994 and 1996, when it entered the middle of the field.Agg. Assault Rate

[10] Figure 7.  NYC peaked in 1988, at a rate similar to Houston, San Diego, Chicago, and Las Vegas.  Dallas and San Antonio were much higher.  The sharpest decline came between 1993- 1996.  Since 1994, when tied with Philadelphia, NYC has been the lowest rate and below the national average.  Philadelphia and Houston have seen the least changes, while San Antonio remains high despite the major decline.Larceny Theft Rate

[11] Based on NYPD reported data from their categories: Seven Major Felonies, Non-Seven Major Felonies, and Total Misdemeanors.

Posted in Police | Tagged , , , , , , , , , | 6 Comments

Crashing the System with Stop and Frisk

S+F Crash the System

If every New Yorker went to court separately, claiming NYPD harassment, when not arrested or cited.

The Floyd v. New York class action suit, to hold the city accountable for hundreds of thousands of baseless harassments by the NYPD, is the affordable option for NYC taxpayers and the court system.  If each plaintiff were to bring a harassment lawsuit against the NYPD under civil rights provisions of § 1983, it would crash the system.

Over the past decade, NYC has arraigned roughly 300,000 cases per year.  Felonies have declined as misdemeanors have risen, which is consistent with some rhetoric that NYC is a safer city, yet also with allegations that the NYPD has been fudging statistics to re-classify the crimes.  Nonetheless, if individual cases were to begin flooding the court calendar, the calendar would triple in size overnight.[1]

In 2011, the NYPD self-reported 119,163 “uses of force” where there was neither arrest nor summons issued; furthermore, they frisked 324,700 people and issued no form of citation.[2]  Some young females have complained that their frisks amount to groping.[3]  Whether minor or severe, these cases alone exceed the number of misdemeanors in the courts.

According to expert Jeffrey Fagan’s review of NYPD data, in 2011:

  • 150,000 stops lack justification (6.71%)
  • 544,252 lack sufficient documentation (24%)
  • 94.67% of stops result in no arrest
  • 93.74% result in no summons

The 2009 Court Budget: $116,147,109

  • Court Revenue: $36,376,655
  • Avg. Summons $/per summons: $14.63
  • Fine Revenue  $15,516,708
  • Bail Revenue $ 10,357,294

A simple comparison of NYC court data[i] shows that an organized public outcry could overwhelm the system, and require changes such as:

  • Triple the court budget (and possible capital investment);
  •  Overhaul of police practices;
  • Full legalization and regulation of marijuana;
  • Other ways to reduce the reasons to bring people into court.

In one month the typical  NYC criminal court judge handles one trial and one pre-trial hearing.  Every day, they average 28 Arraignments (21 Misdemeanors, 5 Felonies).

If Stop and Frisk “Harassments” and “Assaults” were on the court calendar:[4]

  • One NYC ‘Judge Day’ also includes:
    • 40 Harassment arraignments against the NYPD (S+F, resulting in no summons nor arrest);
    • 5 Assault arraignments against the NYPD (use of force, no summons nor arrest);
    • If 5% of NYPD cases went to trial, there would be approximately 125,000 trials (2005-09);
      • During the same period: NYC Criminal Court handled:
        • 2308 Criminal Trials and
        • 6390 Summons Trials.

This is the first part of a series regarding the landmark Floyd trial and NYPD practices.

Read Part Two: “What They Don’t Tell You About NYC Crime Data.”

See also: Revolt of the Gatekeepers

FICPM Statement on Stop and Frisk


[1]  (see NYC Courts Annual report 2011)

1999-2000 between 350,00 – 400,000: Peak- 2000: 277,280  Misdemeanors; 67,827 Felonies.

2001-2005 steady reduction 325,000 – 300,000: Nadir- 2004: 226,769 Misdemeanors; 55,187 Felonies.

2006 – 2009 steady climb back to 2000 high: Peak- 2009 276,112 Misdemeanors; 54,970 Felonies.

Note: Felonies peaked in 2007 at 61,396

[2] Fagan, NYPD data of UF-250 reports

[3] See also: https://www.freespeech.org/text/are-nyc-police-groping-women-protesters

http://my.firedoglake.com/phoenix/2012/05/05/nypd-using-sexual-assault-as-law-enforcement-tool/

http://gothamist.com/2012/02/29/stop_and_frisk_press_conference.php

[4] The S+F cases would be civil rights cases, not criminal cases, and be placed on the civil calendar.  The criminal court calendar is used for purpose of contrast, as this is the behavior that NYPD are asked to catch.  Whereas prevention is impossible to accurately assess, police are generally asked to catch perpetrators of crimes reported to them.


[i]          

2005-2009 Data Manhattan Brooklyn Bronx Queens Staten I. Total
Trial Convictions (arrest cases) 472 476 298 67 1,312
  • Acquittals
281 379 298 105 996
Pre-Trial Hearings 529 677 2,340 694 4,240
Arraignments 507,064 472,214 369,570 337,316 56,093 1,742,257
  • Felony
79,755 78,685 74,581 49,997 10,346 293,364
  • Misdemeanor
366,729 338,701 293,364 238,576 42,086 1,259,383
Trials (summons cases) 590 1,249 3,053 1,776 25 6,390
Summons 842,582 885,208 653,499 551,123 83,808 3,016,230
  • S+F Summons
175,638
 
  • S+F Arrests
150,667
Potential Harassments/S+F 2,479,356
Potential Assaults/S+F (self reported use of force/no citation) 333,320
Total S+F Stops 609,959 1,020,667 417,899 634,153 123,044 2,805,721
# Calendered Cases (if filed) 1,407,741 1,875,360 1,188,480 253,145 4,724,726
Judge Days (if filed) 20,158 23,103 14,750 3354 61,365
Posted in Courts, Police, prison economics, Race | Tagged , , , , , , , , , , , , , | 5 Comments

Is Racism Really This Blind?

images-3UPDATE:  10 members of Congress call on the team to change their name.

U.S. trademark law says that there is no commercial protection for a disparaging term or symbol.  In 1992, the Trademark Trial and Appeal Board agreed that “Redskins” may disparage people, living or dead, or bring them into contempt or disrepute.  Since then, schools across the country such as St. John’s and Tallequa changed names away from Native American epithets like the “Redmen.”  The NFL team, however, had this decision reversed after the court ruled that these plaintiffs waited too long after they turned 18, the age of majority.

The issue is back, and this time the plaintiffs are teenagers.  The nonchalant treatment of this story makes me think of how quickly people are to dismiss or overlook racism.  From the comfort of one’s home, they utter things like the injustices caused Native Americans are long passed, and there is nothing I can do about it now.  While they root for RG III and the resurgent Washington Redskins on Sunday afternoon.  While the poverty level, and resources, on Reservations is abysmal.  While lawsuits over mineral rights continue in the courts.

images-4The football team has recently been deemed as the second-most valuable NFL franchise, worth nearly $2 billion, generating revenues over $350 million annually.

Is there a dispute that the term “Redskin” is a racial epithet?  There is no indication it ever became anything other than such.  All the Super Bowls and all the Quentin Tarrantino films will never turn a slur into an acceptable label, no matter how common the usage.  People aren’t out on the Rez saying, “Yo, what up Redskin?”  Nobody of Native American heritage ever introduced themselves as a Redskin.

images-5In 1967, when the Washington, D.C. football team chose their name, Native Americans around the country were politically active.  During that era, the American Indian Movement occupied Alcatraz Island, Mt. Rushmore, and the Bureau of Indian Affairs office in D.C.  The AIM banners did not have Redskins.  These activists were, like many others, fighting for equal rights in this country- and also reparations for what had been taken away by force and by fraud.

In 1971, the Golden State Warriors eliminated Native American imagery from their nickname and in 1989 the Kansas City Chiefs stopped with the Indian-on-a-Horse gimmick.  The 1992 Super Bowl in Minneapolis, a city with one of the largest Native American populations, included a protest about the football team from D.C. who went on to win the game.

If the Washington, D.C. football team wishes to honor people of local history, perhaps they can find a word for the slave labor that built much of the District, including the Capitol and Supreme Court.  But as the judge in the current trademark case said, the team can call themselves the Washington N-word with nothing but honorable intentions and still be subject to scrutiny.  The fact that the “Redskins” are in our nation’s capital makes it all the more offensive, whereas the near-genocide of this continent’s original people should be a wrong that deserves righting, not ridicule.

Even Southern nicknames, like the Runnin’ Rebels, can make a case for honoring the people who fought for their land, regardless of how pure their motives.  We don’t see the Tennessee “Damn Yankees” or the Massachusetts “Klansmen.”  UMass, incidentally, are the “Minutemen.”  Similarly, the New England “Patriots” use an honorable word as pride in local history.  Nobody is called the “Tories,” in honor of those who supported the British.

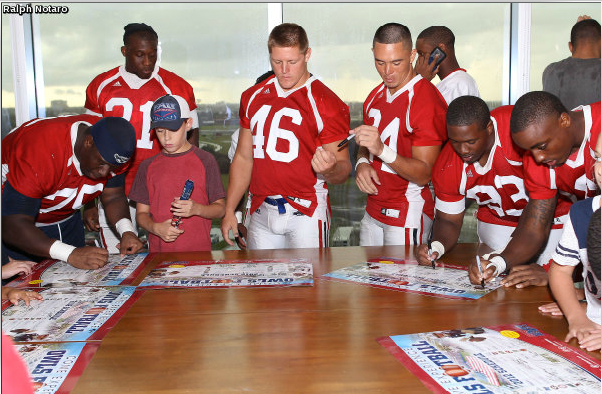
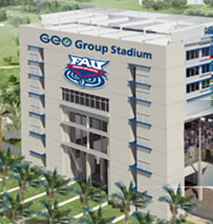
It seems to me that the most distinct Native American nickname, the U. of North Dakota Fighting Sioux, is arguably cast in an honorable light.  Although some Native Sioux supported the name, the state’s voters overwhelmingly decided to drop it in 2012.  This is after the NCAA began sanctioning the school, and there were repercussions looming from their conference.  Might a similar fate be in store for Florida Atlantic Owls, after selling their stadium naming rights to a for-profit prison corporation?  The stadium is already labeled “Owlcatraz.”  (Pretty witty, you must admit.)

North Dakota responded to action taken in 2005 by the NCAA to attempt an eradication of names it considers hostile or abusive.  The list included the Braves, Fighting Illini, Seminoles, Chippewas, Utes, and Indians.  Interestingly, none of these terms are as disparaging as “Redskins,” and the NCAA chose to exempt North Carolina-Pembroke because, historically, 20% of their students are Native Americans.  Central Michigan’s team was removed from the list after the Saginaw Chippewa Tribal Nation gave its support, as did the Seminoles, Utes, and Choctaws.

Ironically, Oklahoma is most populous of Native Americans, their teams are named after Sooners (who came to get the “free” land “liberated” from Native ownership) and Cowboys- not the Indians.  Southeastern Oklahoma State was the “Savages,” but changed to the “Savage Storm.”  Washington, D.C.’s connection to Indians: Broken Treaties and the War Department that ordered continual confrontations and building a series of military outposts to expand West and South.  There is no tribe that can give its blessing to “Redskins.”

strongbow213aSeveral states now have laws barring Native American mascots.  In 1994, the St. John’s Redmen became the Red Storm.  Two years later, the Miami (OH) Redskins became the Red Hawks; a change they had contemplated since 1972.  Making the change has not ended their existence.

There are no nicknames like the “Blackies,” “Yellowmen,” or “Crackers.”  And there should not be.  Would the “Berlin Kikes” be okay in another 100 years?  No.  Claiming ownership of another culture’s symbols, and then to say it is honoring them despite their protests against this “honor,” is racism.  War paint is like back-face.  Foam tomahawks and spears, along with beers, is denigration.

An amicus brief by the NFL Players Association, supporting the trademark cancellation, would not be out of the question.

Unlike the Vikings and the Spartans, Native Americans are living with us among the diverse fabric of our nation.  People have a right to decide how they will be characterized and not be rendered into caricatures.  If a corporation arguably has a right to trademark someone else’s cultural symbols (which I am not certain they do), the Lanham Act certainly outlaws such names and symbols that are disrespectful.

tomahawk_tony0002_2Just because millions of people may be unaware of history does not absolve the insult upon those who know, particularly those who are impacted.

Posted in Commentary, Courts, Race, Sports | Tagged , , , , , , , , , , | 1 Comment

Scaling Back Voting During Black History Month?

English: President Lyndon B. Johnson signs the...

English: President Lyndon B. Johnson signs the Voting Rights Act of 1965 while Martin Luther King and others look on (Photo credit: Wikipedia)

Today the Supreme Court heard a case about the Voting Rights Act, Shelby County v. Holder– specifically, whether we still need special protections in “Covered” jurisdictions- places where the legacy of racism and voting rights is so deep it requires a different standard.  Some have argued that we are over this past, and it is time to move on.

The standard in non-Covered jurisdictions is that a voting practice or procedure, such as Voter ID or redistricting, is only illegal if it is crafted with an intent to discriminate against people of minority ethnic or language groups.  This is part of Section 2 of the Voting Rights Act.  But this historic piece of Civil Rights legislation was not passed in a vacuum.  History teaches us that in certain areas the machinations and chicanery of racism has sidestepped the 15th Amendment at every turn.  Once one discrimination tool is struck down, a slightly different one rises in its place.  Therefore, Section 5 of the Voting Rights Act says that in these places, such as Louisiana, Alabama, and Mississippi, we won’t argue about what you meant to do- we are just going to look and see if it has “Discriminatory Effects.”

One key component at work, although not addressed in Shelby County v. Holder, is that the primary tool for discrimination in America today has evaded protection under the Voting Rights Act.  Felon Disenfranchisement is keeping roughly six million people from the voting booth, nearly 90,000 in Louisiana alone.  Four million people living in the community are not allowed to engage in the most basic element of citizenship: voting.

This “New Grandfather Clause” has been considered outside the Voting Rights Act because slavery, and basically revoking citizenship, is still legal under the 13th Amendment as long as that person has been convicted of a crime.  Interestingly, the 9th Circuit found that the criminal justice system has discrimination, and disparate effects, throughout all levels.  They did not find the felon discrimination in Washington state to be illegal however, unless it was shown that the discrimination was intentional.  This implies that the VRA’s Section 2 would protect people from such schemes to disenfranchise.

Yet what if the challenge in Washington came within a “Covered” jurisdiction?  What if the same discriminatory effect were shown throughout all levels of the criminal justice system?  The federal agency Equal Employment Opportunity Commission (EEOC) has declared that such effects are endemic throughout the system, thus convictions should not be used as a divider between the haves and have-nots.  Should Section 5, if surviving the latest and greatest challenge, be implicated in his massively successful tool to disenfranchise millions of (disproportionately) Black Americans?

Those who feel racism, whether overt or subtle, no longer exists in our policies have not been paying close attention.  Much of the Voter ID advocacy reeks of anti-Latino racism.  The police are still being heavily deployed in low income communities of Color, rather than dispersed evenly or, if targeting drugs, in college dorms.  Civil suits are still being filed against government officials accused of racism in the workplace, and some are victorious.  Drug testing for select people receiving government benefits also has the taint of racism and classism, as those getting the smallest benefits were put in the box.  And racialized districting can easily ensure that overwhelmingly Black and Latino districts are split across wealthier White suburbs, and create a whitewashed legislature.

Discrimination is a human emotion that grows out of wanting the best for “our” people.  The Us/Them dichotomy creates a world of negativity, and it did not suddenly spring up in 1765, than disappear in 1965.  Nor is it confined to The South.  Pretending as such only exposes oneself to ridicule.

It may be a month or so until a decision is reached on Shelby County, but the oral argument will be available here.  It is surely good listening.

Posted in Courts, Race, SCOTUS, Voting Rights | Tagged , , , , , , , | Leave a comment

FAU and GEO: Expecting Black Men to Play In Stadium Named After Prison

FAUI highly doubt any of the 99 players of the Florida Atlantic Owls were consulted about playing in The GEO Group Stadium next year, named after the world’s largest prison-owning corporation.  I also doubt I need to illustrate the percentage of the Owls roster who are Black, or the percentage of The GEO Group’s “roster” are Black.

For those who truly believe in the concept of the student-athlete, we are asking these Owls to become refined leaders in the community, and football talents just happen to be a way to get there for free.  College sports have produced a plethora of Black leaders in America, including Jim Brown, Kareem Abdul Jabbar, and John Thompson.  None of whom I could imagine being affiliated with a corporation that profits off the destruction of Communities of Color.  It may as well be called “Prison Stadium.”

Screen Shot 2013-02-19 at 4.14.56 PMThe Geo Group’s CEO, George Zoley, is an alum of FAU, and former Chairman of the Board of Trustees, and become a mega-millionaire behind the increased incarceration through the War on Drugs and what’s known as “the Immigrant Goldmine.”  This is well documented, including GEO’s flagship role, in a report called “Gaming the System.”  One can imagine the effectiveness, considering this bold move, in lobbying policymakers across the country to keep on locking people up.  Private prisons make money off the excess, so they need state and federal capacities to burst.  Furthermore, they do not make money when a person is released on bail awaiting their immigration proceedings.  GEO makes money when a person is detained, as long as possible, before deportation.  These shareholder goals have driven policy across the nation.

Of course, the students are free to do as they wish.  Some will take the scholarship, play, and keep their mouths shut.  Facing a devil’s bargain is never fair, and people should not expect these kids to shoulder the entire burden.  History tells us this is not always the case.  Now FAU expects to host Middle Tennessee, Marshall, Tulane, New Mexico State, and FIU during the 2013 season.  There is an opportunity to carry a message with each one of those visits, or not.  It would be interesting if officials from Conference USA or the NCAA themselves stepped in.

The reek of slavery, and exploitation of young Black men, should force this $6 million deal off the table.  The insults to players has already begun, and I would not want to be the coach trying to recruit for this school.

Imagine a women’s professional basketball team playing in Larry Flynt Stadium.  Or better yet, Stanley Kowalski Stadium.

Posted in Commentary, Private Prison, Race | Tagged , , , , , , | 4 Comments

Unprison 2011-2013 Index

images-2

Below you will find an index of the articles written over the past several years for Unprison.  Readers are encouraged, as issues arise in your area, to utilize the research, analysis, and opinions presented below.  Some of these have appeared elsewhere, such as AlterNet, Huffington Post, The Guardian, DailyKos, LA Progressive, Hollywood Progressive, RI Future, and SF BayView.   Most of this writing has spawned from direct experience working on the topic, and attempts to incorporate the hard work of others in this area of expertise. *Asterix articles are preferred reading.

Articles prior to 2011 should be forthcoming.

Economics

Rehabilitation and Education

Prison Conditions

Drug Policy

Employment and Housing

Voting Rights

Innocence and Death Penalty

Police

Prison-Based Gerrymandering

Politics and Legislation

Commentary and Miscellaneous

Posted in Actions, Commentary, Courts, Death Penalty, Drug Policy, Education, Employment, Housing, Innocence, Legislation, Mental Health, Police, Political Prisoners, Politics, Prison Conditions, prison economics, Prisoner Health, Race, Rehabilitation, SCOTUS, Uncategorized, Voting Rights | Tagged , , , , , , , , , , , , , | 3 Comments

New Scholarship Program to Reverse School-to-Prison Pipeline

TTEFFINALOriginally appearing on TTEF’s blog.

“As founders of a new and unique endeavor, we welcome you to the Transcending Through Education Foundation (TTEF). We have come together to create TTEF to help reverse the school-to-prison pipeline and establish the prison-to-school pipeline, We will provide financial scholarships and other support services for men and women, including juveniles, in prison (or transitioning out of prison) who are pursuing higher education. TTEF will initially begin in Rhode Island, our home state, and then seek to expand as our resources allow.

Among the compelling reasons we founded TTEF are because:

  • We want to help fulfill an unmet need. College financial aid for men and women in prison, and those transitioning out of prison, are scarce. Notably, Congress banned Pell Grant eligibility for people in prison in 1994. TTEF will help those who face these struggles by providing them with funding and mentors in support of their education.
  • Recidivism rates are significantly lower for people who pursue an education, particularly a college-level education. For example, the national rate of re-incarceration across the United States is 43%, but 0% of inmates who completed the Hudson Link college education program offered in New York’s Sing Sing Correctional Facility returned to prison. The documentary film “Zero Percent,” profiling Hudson Link, is an inspiring portrayal of what a strong educational program for inmates can accomplish. Of course, the tax savings when people do not return prison are significant, but just as important is the strengthening of communities when former inmates return as educated individuals who are able to raise strong families and be solid neighbors.
  • Providing educational opportunities to prisoners creates economic benefits for everyone. In Rhode Island, it costs $49,133 per year to incarcerate one person. By supporting those who pursue an education, Rhode Islanders will be able to shift resources from incarceration to other pressing needs. Moreover, educated individuals are more likely to obtain gainful employment, which is particularly challenging in a tough economy—and especially trying with a criminal record.

From just these three reasons, among many more, supporting TTEF’s work is clearly a win-win proposition.

We also have personal reasons for establishing TTEF. We all began our respective educational journeys inside of prison. Therefore, we know and understand the transformative powers of education first-hand. Because of our education, today we find ourselves fortunate to be in the position to pay it forward. We are excited to do so, and encourage you to join us.

In the beginning, our goals will be modest. We will give between one and three scholarships, worth up to $1,000 dollars each, to Rhode Island inmates or recently released inmates pursuing a higher education. We will also provide support services to our scholars to help them chart their own educational journey. As our resources increase, our scholarships and services will also increase. To that end, we encourage you to visit our website and make a tax-deductible donation at www.transcendingthrougheducation.org.

We are currently recruiting other candidates to our Board of Directors and Advisory Board, and we will introduce them shortly.

Please subscribe to our blog to get important updates. On here, we will highlight personal stories, policy initiatives, and economic data that relate to our vision and mission of supporting the education of inmates and former inmates. We will also discuss education for underprivileged men and women in the United States more broadly. You can also find us on Twitter and Facebook.

We hope you will support this project and join the discussion. Regardless of one’s views on the criminal justice and education systems, we firmly believe that our end goals are the same: better educated citizens means a better society for everyone.

We invite you to visit our website at www.transcendingthrougheducation.org to learn more about TTEF. You may contact us atinfo@transcendingthrougheducation.org.”

Best,

Andres Idarraga, President

Noah Kilroy, Secretary

Bruce Reilly, Treasurer

Posted in Education, Prison Conditions, Rehabilitation | Tagged , , , , , , , , , , , , , | 2 Comments

Alliance Pushes Census Bureau on Miscounting Prisoners

momentum_590wPrison Policy Initiative has been at the forefront of the longstanding dilemma where prisoners have been used to bulk up the populations of rural prison towns, while draining numbers from the urban centers they are arrested in.  The victories seen in the past several years show the value of having a central hub on a single issue.  Below is a sign-on letter getting major attention among people dealing with both political and prison issues.    I encourage people and organizations to add their support.

SIGN ON LETTER TO THE CENSUS BUREAU – FEBRUARY 2013

We are looking for organizations to sign this letter. The 4-page backgrounderabout this letter may be helpful. Don’t hesitate to contact us with questions or for a list of which organizations have already signed. Signatures are due February 6, 2013.

February X, 2013

To:
Thomas Mesenbourg
Acting Director, U.S. Census Bureau
4600 Silver Hill Road
Washington, DC 20233

We are writing about the consequences of the Census Bureau’s policy of tabulating incarcerated people as residents of prison locations, rather than at their home addresses. We write as organizations with an interest in ensuring fair and equitable representation for all people and communities.

We are concerned that the Census Bureau’s tabulation procedures distort the redistricting process, giving extra political influence to people who live near prisons while diluting the votes of residents in every other legislative district. This practice skews democracy on both the state and local levels and is especially problematic for county and city governments, where a single prison can easily make up the majority of a district.

We know that even though the next census is seven years away, planning is already underway. For that reason, we urge the Bureau to conduct the research necessary at this early point in the planning process to ensure that the 2020 census can count incarcerated people at their home addresses.

As you know, the Census Bureau’s current “residence rules” instruct the Bureau to tabulate incarcerated people as residents of the prison location, even though incarcerated people are not considered residents of the prison location for other purposes. At the time of the nation’s first census, the question of where incarcerated people were counted was of little importance because very few people were behind bars. Today, nearly 1 percent of the U.S. adult population is incarcerated. By designating a prison cell as a residence, the Census Bureau concentrates a population that is disproportionately male, urban, and African-American or Latino in approximately 1,500 federal and state prisons that are far from their home communities.

Failing to count incarcerated people at home for redistricting purposes undermines the constitutional guarantee of “one person, one vote”, with critical implications for the health of our democracy. When the Census Bureau counts incarcerated people at the location of the facility, state or local governments that use “unadjusted” census data for redistricting grant extra weight to the votes of residents who live near the prison and dilute the votes of residents who do not. As the National Research Council of the National Academies reported in 2006, “[t]he evidence of political inequities in redistricting that can arise due to the counting of prisoners at the prison location is compelling.”[1]

Over the past decade, a growing number of stakeholders have urged the Bureau to update the “usual residence rule” to allow incarcerated persons to be tabulated as residents of their home addresses. Although much of this feedback was received too late to influence 2010 census planning, we commend the Bureau for making a useful change in the short time available: creating the Advance Group Quarters Summary File, which was released early in order to allow jurisdictions to identify and remove incarcerated populations for the purposes of drawing their new districts.

The overwhelming national trend is towards adjusting the census data used for redistricting purposes, but more progress is necessary. Four states, containing 21 percent of the U.S. population, passed legislation to adjust census data on their own. Both Maryland and New York passed legislation in time to reallocate incarcerated people to their home addresses for the most recent round of redistricting, and Maryland’s law was upheld by the U.S. Supreme Court.[2] Similarly, more than 200 counties and municipalities that contain prisons made their own adjustments to avoid drawing districts that give extra influence to those who live near prisons.

As former Census Bureau Director Robert Groves explained, the Bureau “re-evaluate[s] our ‘residence rules’ after each census, to keep pace with changes in the society. We’ll do that again after the 2010 Census.”[3] The interim measures taken by the Census Bureau and by individual state and local governments exhibit variety and creativity, but now the time is ripe for the Bureau to enact a national solution by changing how it tabulates incarcerated people.

We recognize that the Census Bureau seeks to conduct the fairest, most accurate, and most efficient census possible, and we understand that this undertaking requires decade-long preparations. We therefore urge you, in your research and planning for the 2020 census, to make developing a methodology to tabulate incarcerated people at their home addresses a near-term priority.

Such a change would provide a standardized national solution to the problem of redistricting distortion due to the tabulation of incarcerated populations, and would relieve state and local governments alike from undertaking piecemeal adjustments on their own. We urge you to take this window of opportunity when procedures for the next Census are being developed to ensure that the 2010 census will be the last to tabulate two million people outside their home communities.

We thank you for your careful consideration of this issue.

Sincerely,

Footnotes

[1] National Research Council, Once, Only Once, and in the Right Place, (Washington DC: National Academies Press, 2006), 9.

[2] Fletcher v. Lamone, __ U.S. __, 2012 WL 1030482 (June 25, 2012).

[3] Robert Groves, So, How do You Handle Prisons?, United States Census Bureau Director’s Blog, March 1, 2010.

Posted in Actions, Politics | 1 Comment

Action Packed Hearing on Public Housing and Criminal Convictions

555194_829567977489_1317684422_nThe public hearing held at Housing Authority of New Orleans (HANO), regarding criminal convictions, turned out to be three hours of praise, criticism, education, and a whole lot more from roughly 200 people.  For some, January 22nd was the first time they had a chance to address HANO federal receiver David Gilmore who, at one point, was called a dictator.  Considering there is no proper board nor local control at the moment, Gilmore holds the powers of a dictator.  It also means that his genuine steps in the direction of inclusion carries the weight of authority.

Leading up to the hearing, local media highlighted public criticism, as good government intentions often go awry when the details emerge.  As noted previously, considerable community input has been submitted to HANO.

I couldn’t stop wondering if Mr. Gilmore was an attorney, if he was familiar with Civil Rights law, or with HANO’s policies that were adopted before his tenure.  For example, he began the evening by clearly stating that the practice of excluding entire families who have a member with a felony conviction is not written in the policy.  I was the second person to testify, and pointed out that the 2011 HANO Admissions and Continued Occupancy Policy (ACOP) explicitly lists multiple barriers for those with criminal histories (with no need for an actual conviction).  I even read from page 23, barring all those with a conviction within the past 7 years for drug activity or violence.  He was appointed to fix HANO in 2009 and, in his defense, there has been a lot of work to do.

Mr. Gilmore also confirmed my suspicions that the Policy Statement issued by HANO weeks ago is only serving as a guiding set of principles- it is not an actual policy.  Many people still took issue with some of the vague terminology in the Statement, such as barring (from housing and employment) all sex offenders and those with a “history of domestic violence.”  Over the course of the hearing, Gilmore was told in various ways how the broad terms leave no room for degrees of criminal activity, nor someone being able to move on after serving their time.  He mentioned how abusers and serial child molesters are just “wired that way,” which some people would disagree with.  However, he heard from people who support domestic violence victims, or who have represented prostitutes, even someone convicted of a sex offense- all of whom educated Mr. Gilmore on the way the law can label a variety people for life, with consequences such as being barred from subsidized housing.  Nobody argued that living under I-10 was legal, safe, or contributes to a healthier New Orleans.

Employment policy takes heat

Many people expressed how employment and housing standards don’t match up in the same way- that one single policy cannot apply.  In a very nuanced way, perhaps a policy could, however the point was that someone’s criminal history should be relevant to the housing or job sought- or else not even considered.  This would be considered part of the EEOC Guidelines issued last year, which was the heart of my own testimony: that HANO’s policy should be drafted in a manner that protects them from Civil Rights lawsuits regarding Disparate Impact discrimination.  Written testimony from Voice of the Ex-Offender, Justice and Accountability Center, and Stand With Dignity all went into deeper detail of the EEOC significance.  The other night, however, Mr. Gilmore truly was not sure how the two agencies’ policies could conflict.

“If anyone can explain to me how this policy would violate civil rights laws, please let me know,” Gilmore said to the crowd, after about five references over the first two hours.  I shouted out that “I can” right now.  He asked that I write it on a paper, so I did- and handed it to a housing attorney for Southeast Louisiana Legal Services who had yet to testify.  He had prior experience in domestic violence, so he had much to say beyond a brief explanation of how the government has accepted that the criminal justice system disproportionately impacts People of Color, thus blanket discrimination via convictions will serve as a proxy for racial discrimination.  A policy needs to be tailored in ways that factor in the nature of the conviction, time elapsed, nature of the job, and an individualized assessment.

Mr. Gilmore never fully understood why it matters that a background check be done after there is an offer of employment, and nobody quite clarified: studies show that the presence of a record, regardless of the details, negatively influences the reviewer’s decision.  For many, there is an instant trashing of the application and the manager does not even see it (some online systems will filter out all who check “yes” to the question).  The applicant is not able to express their value as an employee, nor given an opportunity to explain the circumstances of their criminal record.  Studies show that given that chance for an interview, employment skyrockets.  Furthermore, I am not aware of any studies showing that employees with records have worse job performance than the unconvicted.  There is ample anecdotal evidence to suggest just the opposite.

“It doesn’t matter to me,” Mr. Gilmore finally pronounced.  “The question is off the application starting tomorrow,” referring to the question about criminal conviction.  The room applauded.

Evictions: Public Safety or Increasing Homelessness?

The matter of evictions became hotly contested, with conflicting stories regarding the facts of specific families.  A group from River Garden, a semi-autonomous mixed-income housing development that is federally subsidized and under the umbrella of HANO (like several other such properties, a growing trend), was very explicit:  “This is gentrification,” one said, as lower income people are replaced by those with higher income.  They explained how some people are targeted, others favored, anonymous tips serve as sole evidence; and even an attorney questioned how HANO oversees River Garden to ensure they follow policies.  When someone is evicted under the “1-Strike” drug policy, Gilmore admitted that they merely accept the report from a management agency, without further investigation.

Mr. Gilmore claimed there are only “two or three” evictions per month, and most are for failure to pay rent.  That people have to do something terrible for a third or fourth time.  Lacking the data in hand, I found it interesting that residents and legal workers would have such a drastically different view of the eviction issue.  One element that was very clear: residents felt that a guilty household member should be the only one evicted from HANO, not the entire family (as is practice, policy, and law).  Depending on the circumstances, HANO can (and has) evicted where there was no arrest, or where the criminal activity was not by a household member.  In Gilmore’s view, the head of household needs to be held responsible for all their family members.  In other areas of the law, that is simply illegal, but not so with public housing.

What’s Next?

What is very critical for all parties to understand, all clashes aside, is the trends happening in New Orleans and in subsidized housing.  Katrina plays a role in that, as do changes in management and what influence profit-seeking developers may have in the landscape.  It cannot be disputed that criminal justice policies steadily convict family members at a rate faster than population growth.  There will come a time in the near future, where over 50% of African American families in New Orleans have a member with a criminal conviction.  Considering 1 in 7 Black males are under current supervision of the criminal justice system, those with a lifetime record are far higher.  We are likely near, or over, the 50% marker already.  Will HUD limit its mission to only those who have avoided the courts, or will it seek sustainable housing for all.

No timetable was laid out for developing the policy, nor did Mr. Gilmore mention who it is will help him hammer it out.  Hopefully, he would bring a group together representing both the impacted community members and experts in this area of the law.

Posted in Actions, Employment, Housing | Tagged , , , , , , , , , , | 3 Comments